Staying ahead in today’s fast-paced market means more than just keeping track of sales. It’s about embracing innovative tools to gather, organize, and visualize data for in-depth analysis. At Magestore, we always value customer feedback and continuously refine our products to serve them better. Recently, we’ve released 9 POS sales reports, dedicated to helping business owners easily grasp insights into their sales performance. Thus, they can simplify store management and make informed decisions to excel in the market.
Let’s learn more about these 9 latest sales reports to maximize the power of Magestore POS in improving your business efficiency:
- Sales by Time-frame
- Sales by Coupon
- Sales by Country
- Sales by Customer
- New vs Returning Customer
- Sales by Product Performance
- Sales by Product Feature
- Sales by Product Catalog
- Sales by Payment Type
Why do we need Magestore POS sales reports?
Magestore POS syncs data across channels and locations immediately, then centralizes this data in the Magento backend to create granular and real-time sales reports, thus contributing to accurate business management. With these reports, you can:
- Track multi-channel selling: You can view all data on a unified platform to comprehensively supervise your business performance.
- Optimize sales processes: You’ll identify customer shopping trends, thereby adjusting your business and marketing strategies to convert them more effectively.
- Assess sales performance: You can easily analyze cash flow by product, category, sales channel, time, and many other factors.
- Improve customer experience: By tracking and analyzing customer shopping behaviors across multiple platforms, businesses can personalize the shopping experience to improve customer satisfaction and loyalty.
- Minimize operating costs: You can reduce manual errors and save time and resources in data management. Your staff can focus on customer care activities.
- Enjoy up to 24 detailed insights: You can access many key metrics, such as COGS, Average Order Value, Margin, etc. to understand your business situation fully.
You might like:
What you should know before use
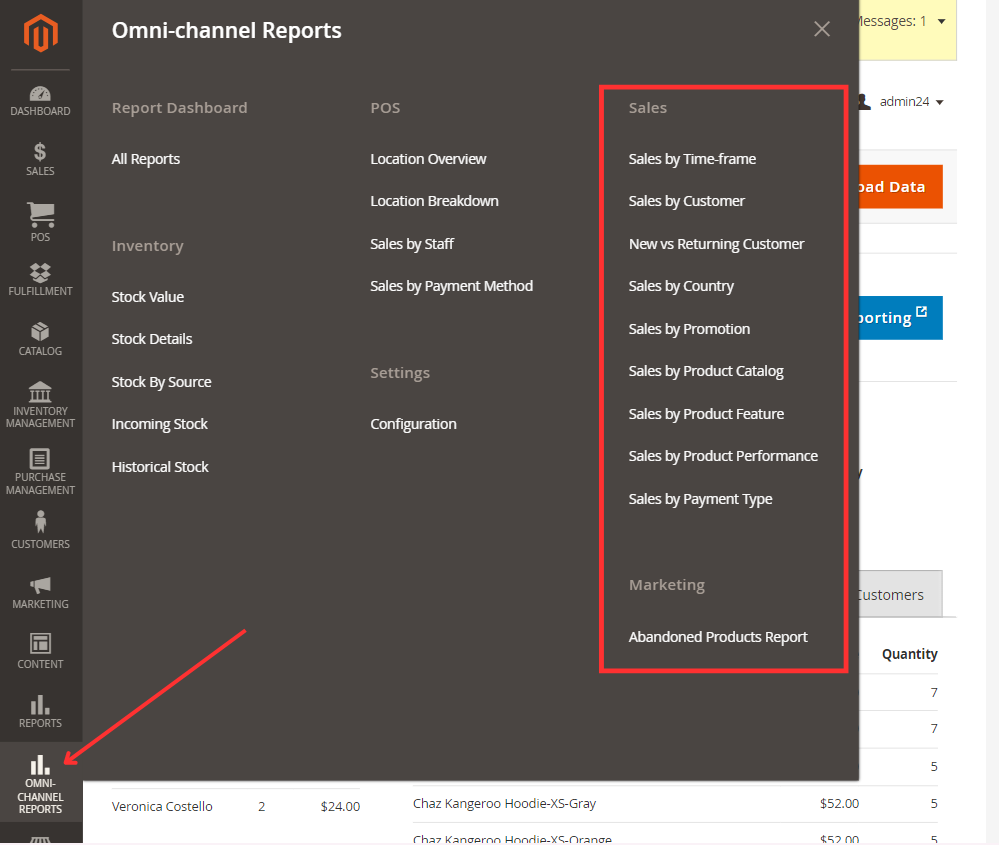
How to access all sales reports:
- Step 1: Log into your Magento Admin Panel
- Step 2: To view sales reports, follow one of the paths below:
- 1. Omni-channel Reports > Report Dashboard > All reports > Sales reports
- 2. Omni-channel Reports > Sales
- Step 3: Select the report you want to view in detail
Automatic update: Data from all channels is automatically updated at night daily. If you want to see the latest information on the reports before this scheduled update, you can manually refresh the data by clicking “Here” at the top of the page.
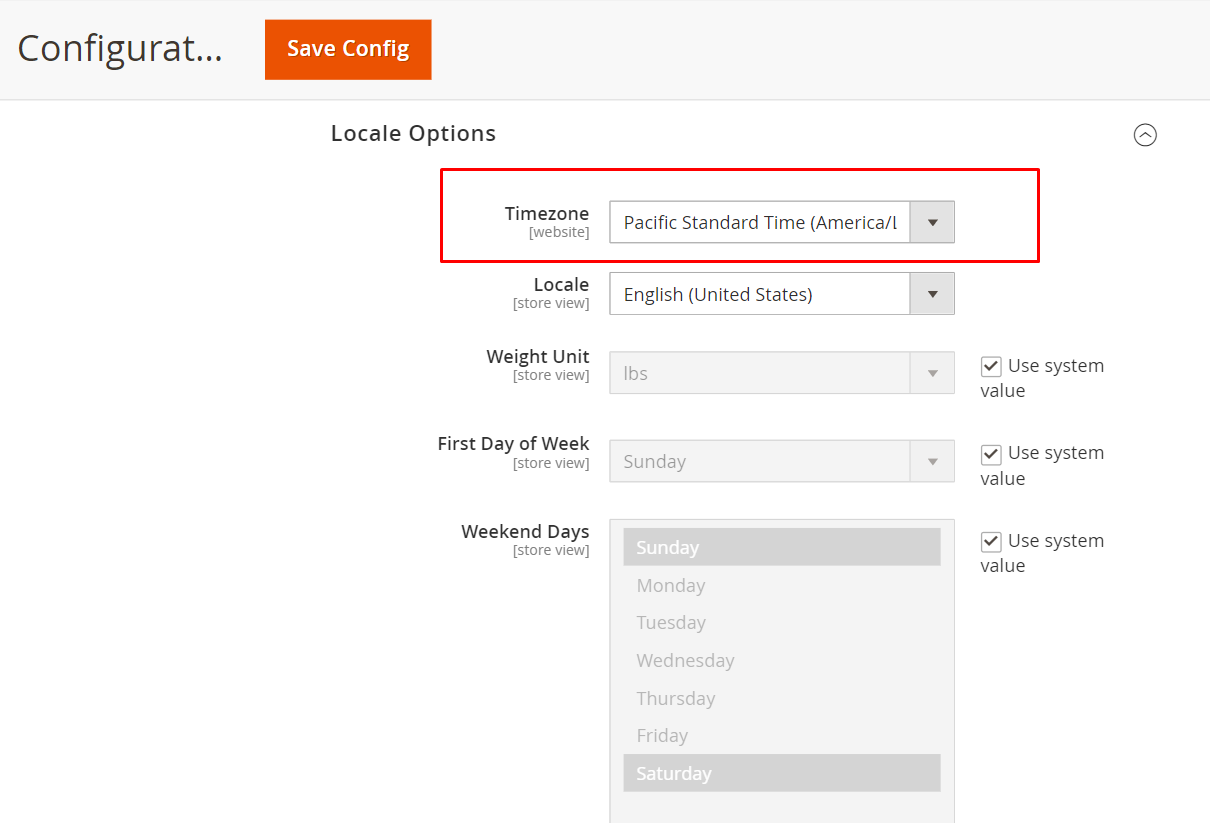
Timezone setup: To ensure data accuracy, match the report timezone to your server timezone. To set up your report timezone, navigate to Omni-channel Reports > Settings > Configuration > General > General > Locale Options > Timezone. If the timezone in this setting matches the users’ settings, it has been correctly configured.
No additional costs: Current customers of the Magestore POS system can simply update to the latest POS version to use these new Sales reports without extra fees.
Magestore sales report components
Key metrics
On the reports’ main page, select the metrics you want to view reports as follows.
- Time range: You can set the time range to see all the orders, from one date to another specific one.
- Data Used: You can select either Order Created or Order Updated. By default, the setting would be Order Created.
- Order Created: Show reports based on the date the order is created
- Order Updated: Show reports based on the date the order was last updated
- Sales Channel: There are three options: All, Website, and POS for viewing reports of a particular channel. The default setting is All.
- Location: Only visible when the Sales Channel is POS. This includes all the available locations where you use Magestore POS. Now you can choose a place to thoroughly analyze its performance.
- Report by: Offer different options in each report type:
- Hour and Weekday in Sales by Time-frame
- Customer and Customer Group in Sales by Customer
- Coupon and Cart Price Rule in Sales by Coupon
- Brand and Category in Sales by Product Catalog
- Attribute and Attribute Set in Sales by Product Feature
- Interval: Provide 3 options with Day, Month, and Year for you to view customer data
- Country by: Include 2 options: Billing Address and Shipping Address.
For advanced filters, you can configure these options to your needs:
- Filters: To quickly narrow down and analyze specific data segments
- Columns: To customize the display of names and data types
- Default view
Moreover, you can export the reports to CSV files for further analysis.
Data visualization
Below the table with raw data, you’ll find your data displayed in a more engaging and digestible way.
Bar chart
The bar chart allows you to compare each metric in the report by selecting the value through the Select Metrics dropdown.
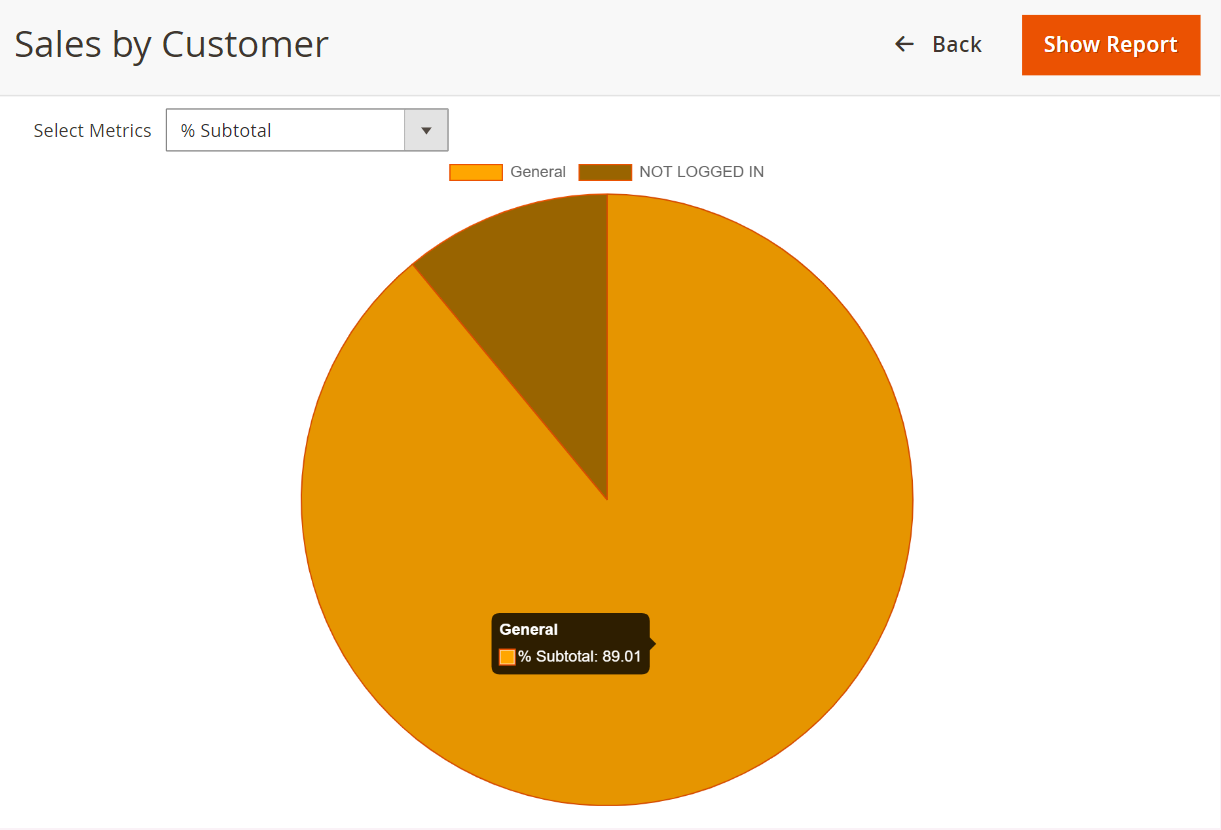
Pie chart
For metrics that highlight how each component contributes to the whole, you’ll see them in a pie chart. Metrics shown in the pie chart include % of Total Revenue, % of Subtotal, % of Grand Total, and % of Total Paid.
The other metrics will be shown in a bar chart for easier comparison.
Detailed overview of 9 Magestore sales reports
To better understand how Magestore retail sales reports function and how to make the most of them, let’s look at each type in detail.
Sales by Time-frame
As a store manager, if you want to track sales changes over time and identify peak times, the Sales by Time-frame report is for you. This information helps you:
- Identify peak sales times to see when your business is busiest, so you can plan accordingly
- Monitor seasonal trends: You can predict busy or slow periods to adjust staffing, manage inventory, and plan marketing strategies.
- Evaluate promotions: By looking at sales data from specific times, you can gauge how effective your discounts and campaigns are. This insight helps you decide if you need more promotions during off-peak hours to boost sales, while also ensuring you don’t overwhelm your team during peak times.
The Sales by Time-frame report page is displayed with the default view as below:
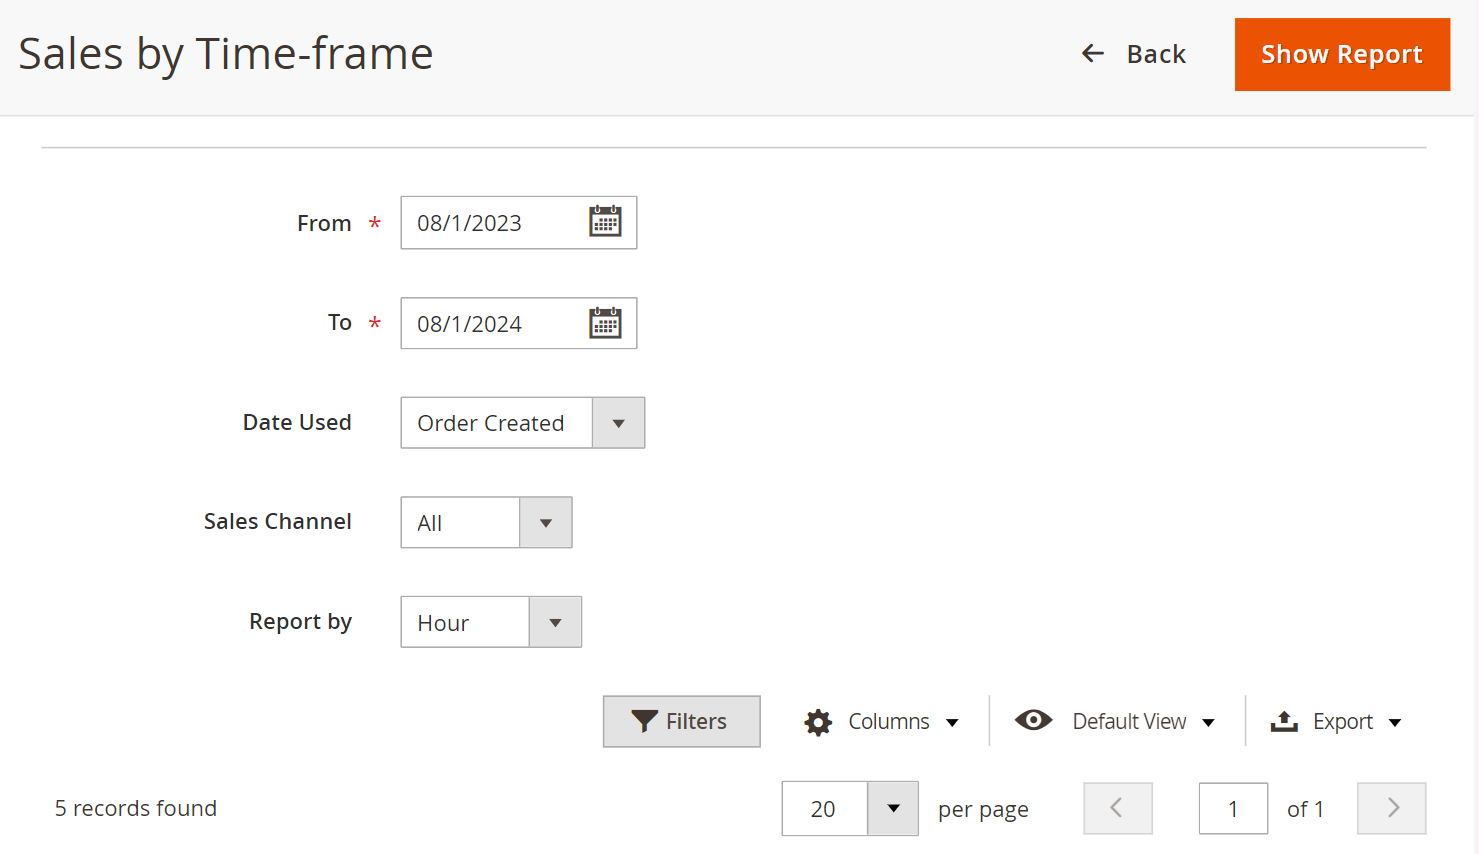
After choosing the metrics and clicking the Show Report button, you’ll see data details. In this report, there are 2 data types:
- Default data that are already shown in the table
- Additional data that need enabling in the Columns setting
Default filters | Advanced filters |
|
|
You can filter the report by Grand Total and Revenue (excl. Tax) to focus on the most relevant data.
For example, to recognize peak times during the day, you’ll need to click on Columns in the top-right corner of the report and select Hour.
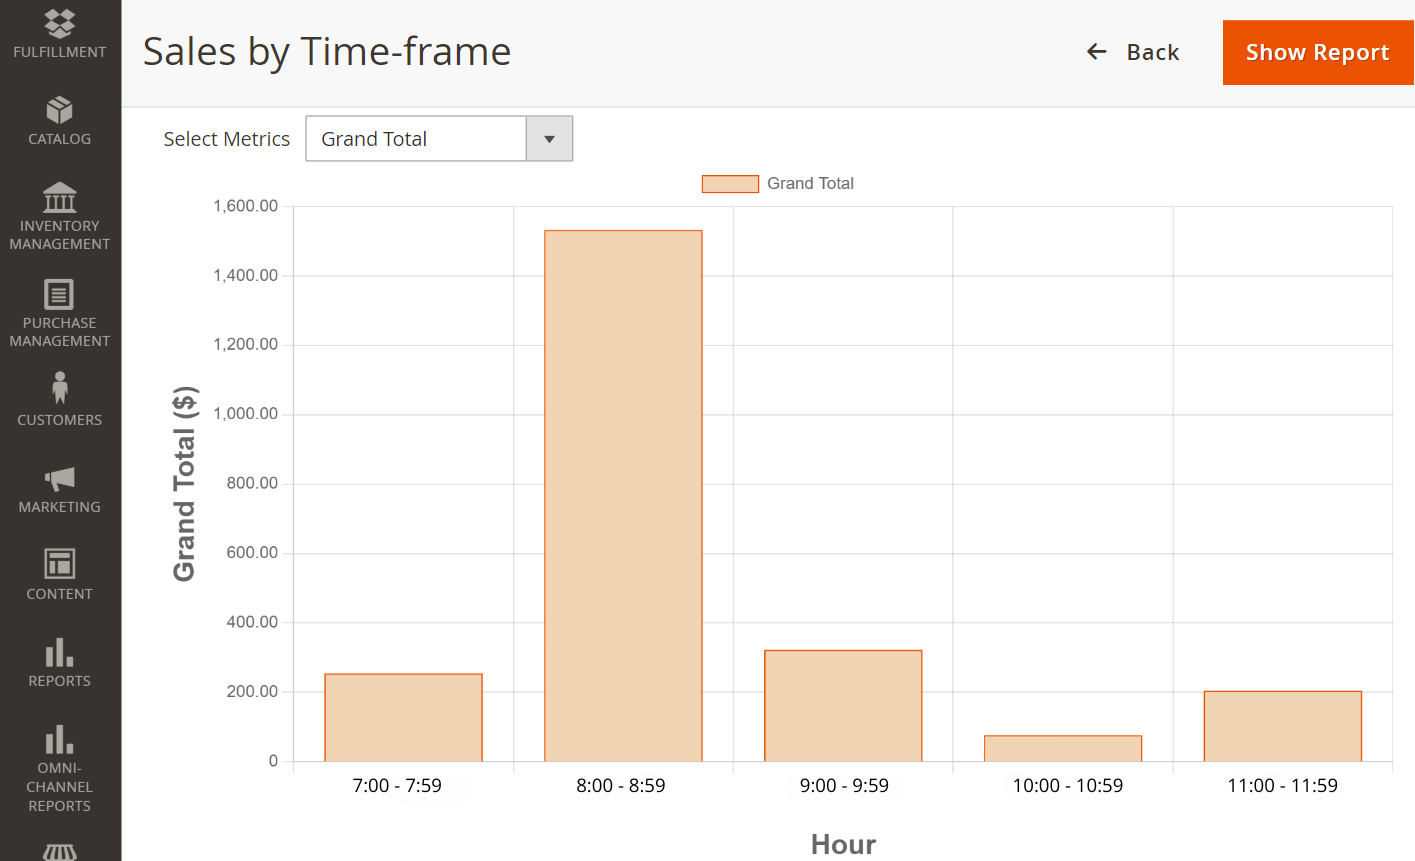
By analyzing the data in the table and bar chart, you can see that your physical stores receive the most customer traffic between 8:00 AM and 8:59 AM. With this in mind, you can:
- Boost staffing: Assign more staff during this busy time to ensure your customers experience great service.
- Provide click-and-collect option: Encourage shoppers to buy online and pick up their orders during quieter times to ease in-store congestion.
- Run off-peak promotions: Attract more customers during slower hours with targeted promotions. To find out which deals work best, take a look at the Sales by Promotion report.
Sales by Coupon
Using the Sales by Discount report, merchants can get a clear picture of which campaigns are driving revenue and which aren’t. Here’s how it can help:
- Track redemption rates: See exactly how often your coupons and discount codes are being used, so you know which offers are most preferred.
- Understand customer preferences: Gain insights into what your customers enjoy and how they shop, allowing you to tailor your marketing strategies more effectively.
- Optimize your marketing budget: By comparing sales from different discount campaigns, you can pinpoint which promotions deliver the best results and avoid spending on those that don’t.
- Manage inventory efficiently: Move unsold products faster without cutting into your profits, freeing up storage space and lowering holding costs.
After selecting the order metrics at the top of the page, you can view the default columns or add additional columns from the options section.
Default filters | Advanced filters |
|
|
To see which coupons are bringing in the most revenue, click on Columns in the top-right corner of the report > select Revenue (excl. Tax).
The data shows that the New Year Coupon brings in the most revenue. Consider the following actions to leverage the results:
- Run similar promotions during other key periods to replicate the success
- Target your marketing: Focus your marketing and advertising efforts on the customer segments that responded best to this coupon
- Analyze which demographics or customer groups engaged with the promotion. Check out the Sales by Customer report to see how different segments respond to discounts and refine your strategies.

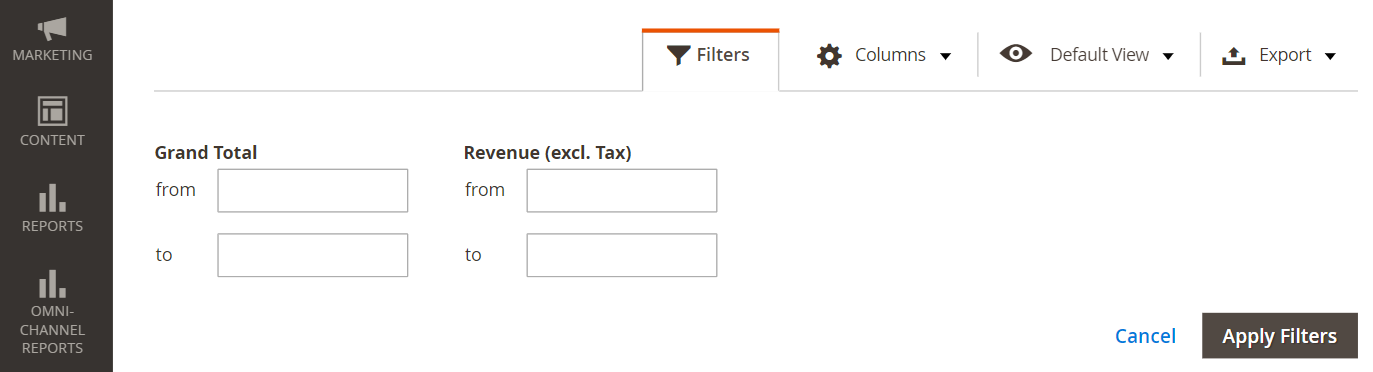
You can filter the report by Coupon, Subtotal, Grand Total, Revenue (excl. Tax), and Average Order Value.
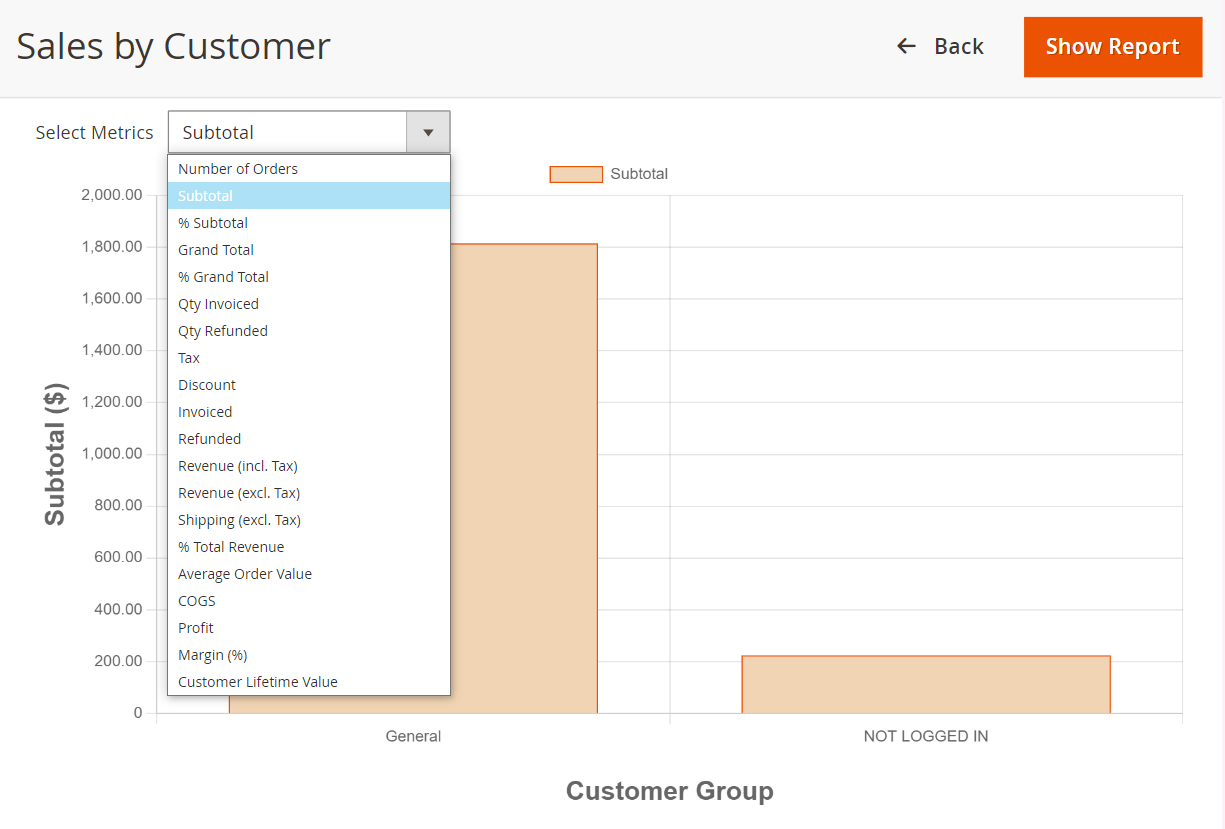
Sales by Customer
The Sales by Customer report offers valuable insights into your customers or customer groups, helping you pinpoint those driving your sales. Here are the main benefits of the report:
- Understand customer segments: By looking at sales data, you can see patterns in purchasing behavior, how often customers buy, and how much they spend.
- Personalize promotions: With a clear view of individual customer preferences, you can create targeted offers to convert and increase customer satisfaction.
- Focus on your top customers: The report shows which customers contribute the most to your revenue, so you can prioritize efforts to retain and grow these valuable relationships.
After selecting the order metrics at the top of the page, you can view the default columns or customize the report with additional columns from the options section.
Default filters | Advanced filters |
|
|
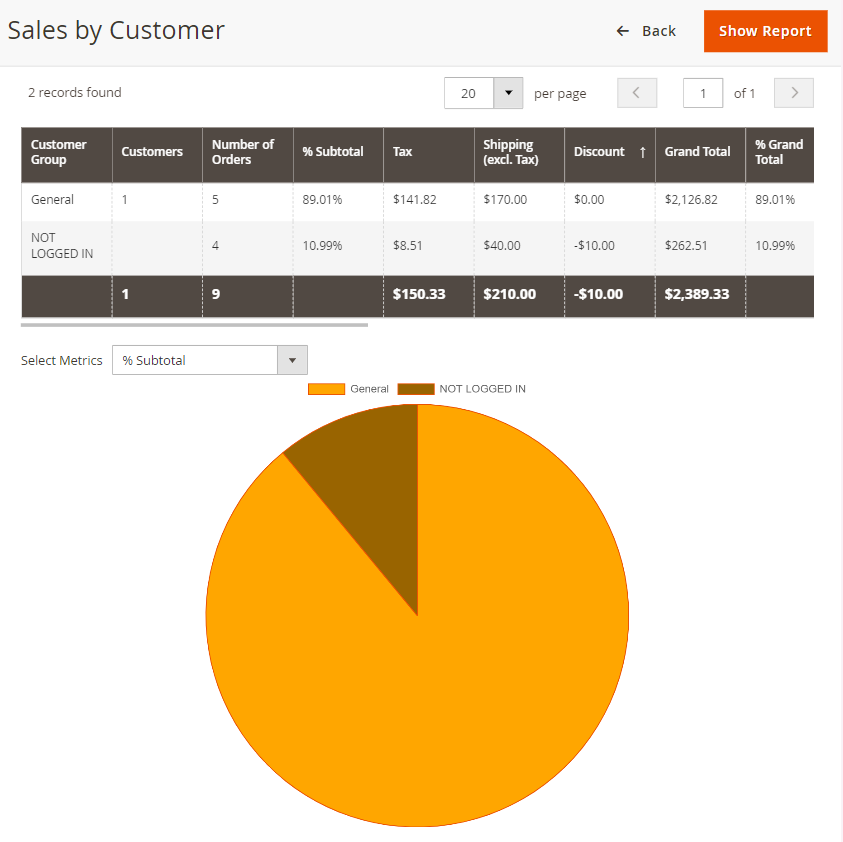
To access Customer Lifetime Value data, click on Columns in the top-right corner of the report > select Customer Lifetime Value.
Analyzing the data in the column and chart report allows businesses to:
- Measure the total revenue generated by a customer during their engagement time with the business, helping to make informed decisions on how much to invest in customer acquisition and retention
- Combine with the New vs Returning Customer report to evaluate their customer base’s current and future value
In this report,
- When filtering by Customer, you can sort by ID, Customer, Customer Group, Customer Lifetime Value, and Grand Total
- When filtering by Customer Group, you can sort by Customer Group, Grand Total, and Revenue (excl. Tax)
New vs Returning Customer
If you’re looking to compare sales between new and returning customers to see which group adds more to your overall revenue, the New vs Returning Customer report is what you need. This report delivers the following value:
- Analyze sales impact: Identifying the share of sales from each customer segment helps you see which group contributes more to total revenue.
- Measure the effectiveness of business actions: The report offers a clear overview of how well you balance customer acquisition versus retention efforts.
After selecting the order metrics at the top of the page, you can view the default columns or customize the report by adding additional columns from the options section.
Default filters | Advanced filters |
|
|
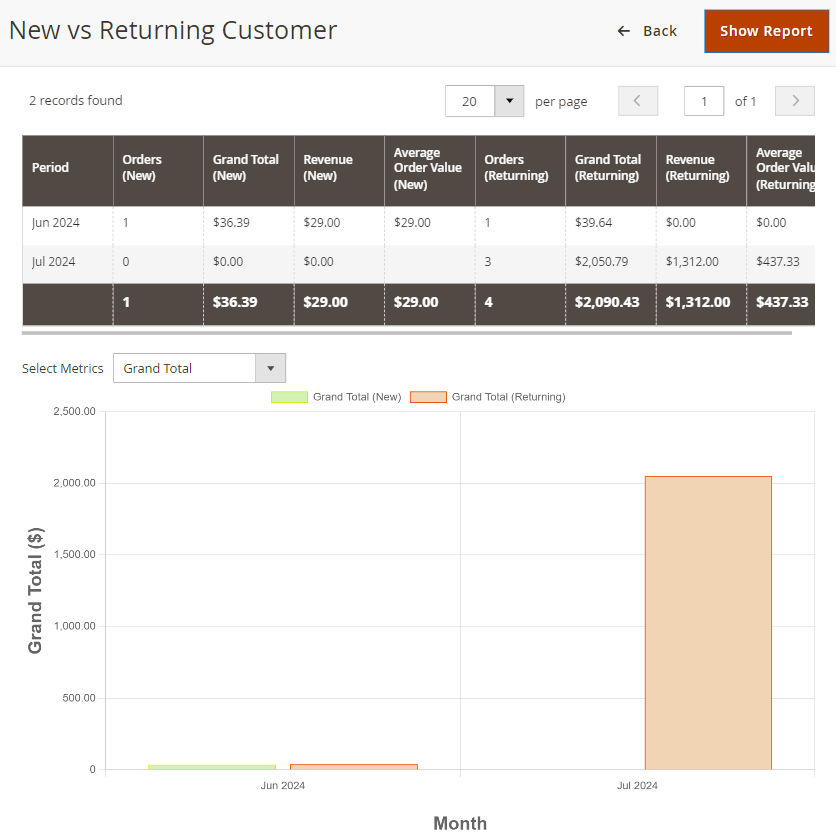
To view the % of Total Revenue (New) data, go to the top-right corner of the report, click on Columns > select % of Total Revenue (New).
The data in the column and chart report reveals:
- How successful your business is at attracting new customers and converting them into paying customers
- How much of your revenue relies on new customer purchases
- The need to invest in new customer segments through marketing campaigns, promotions, and outreach. Merchants can refer to the Sales by Product Feature report to understand which product features are favored by new customers for more precise marketing targets.
Sales by Product Feature
The Sales by Product Feature report gives useful information by specifying what product features (Attribute Value or Attribute Set) bring great revenue or cause profit losses to your business. Here are the key advantages:
- Gain insights into product development: By identifying which features most appeal to customers, you can create new products or modify existing ones to align with market preferences.
- Target marketing and promotion plans: You can focus marketing efforts on specific features that drive sales and boost conversions.
- Gain competitive advantages: The report helps businesses highlight what sets their products apart from their audience and competitors.
In this report, you can view Sales by Attribute and Sales by Attribute Set.
After selecting the order metrics at the top of the page, you can view the default columns or add additional columns from the options section.
Default filters | Advanced filters |
|
|
To view the Qty Sold data, follow these steps: Click on the Columns option in the top-right corner of the report and select Qty Sold from the dropdown menu.
In the Sales by Product Feature report, we observe that the highest quantity sold is attributed to the Attribute Set “Top”, with a total of 20,000 SKUs. This indicates:
- High demand for products in this particular attribute set. For a comprehensive view of how product features impact overall category performance, see the Sales by Product Catalog and Sales by Product Performance reports
- A significant contribution of these products to overall sales volume
- A need for businesses to prioritize inventory management to ensure sufficient stock levels and avoid missed sales opportunities.
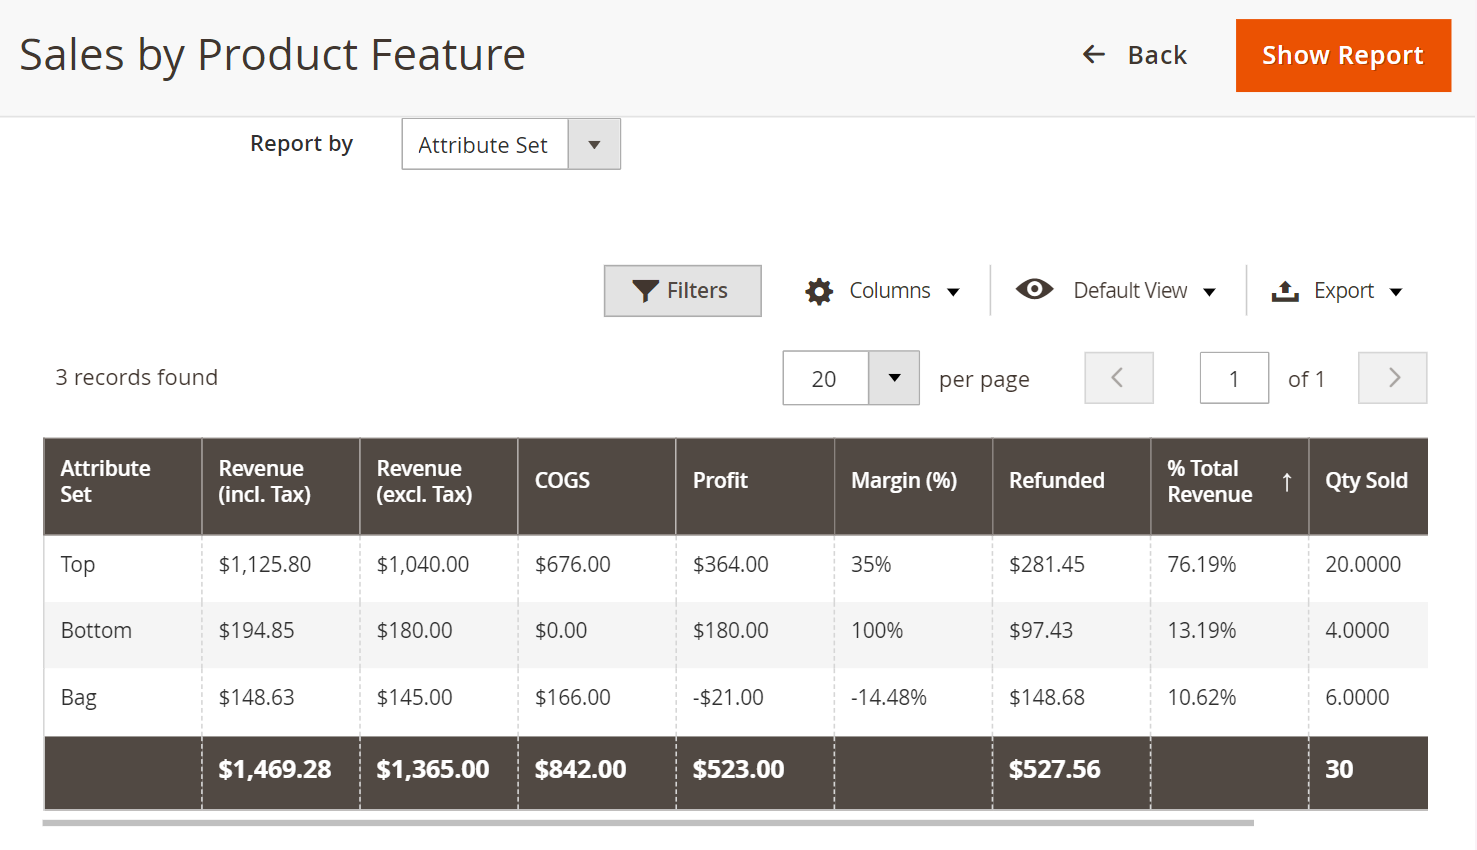
You can filter the report by Product Name, Revenue (excl. Tax) (From-To), Refunded (From-To), and Average Selling Price (From-To).
Sales by Product Catalog
The Sales by Product Feature and Sales by Product Catalog reports have a similar advantage in that both offer in-depth insights into products but from different perspectives. While the Sales by Product Feature report breaks down sales based on specific product features, the Sales by Product Catalog report details sales performance across various product categories or brands.
After selecting the order metrics at the top of the page, you can view the default columns or add additional columns from the options section.
Default filters | Advanced filters |
|
|
To view the COGS (Cost of Goods Sold) data in the Sales by Product Catalog report, simply click on the Columns option in the top-right corner > select COGS (Cost of Goods Sold) from the dropdown menu.
Understanding the cost structure of each product category is key to running a successful business. By looking at COGS, you can check whether your product pricing can cover the costs. If COGS is much higher than what you’re earning, it means you’ll need to adjust your pricing or find ways to cut costs.
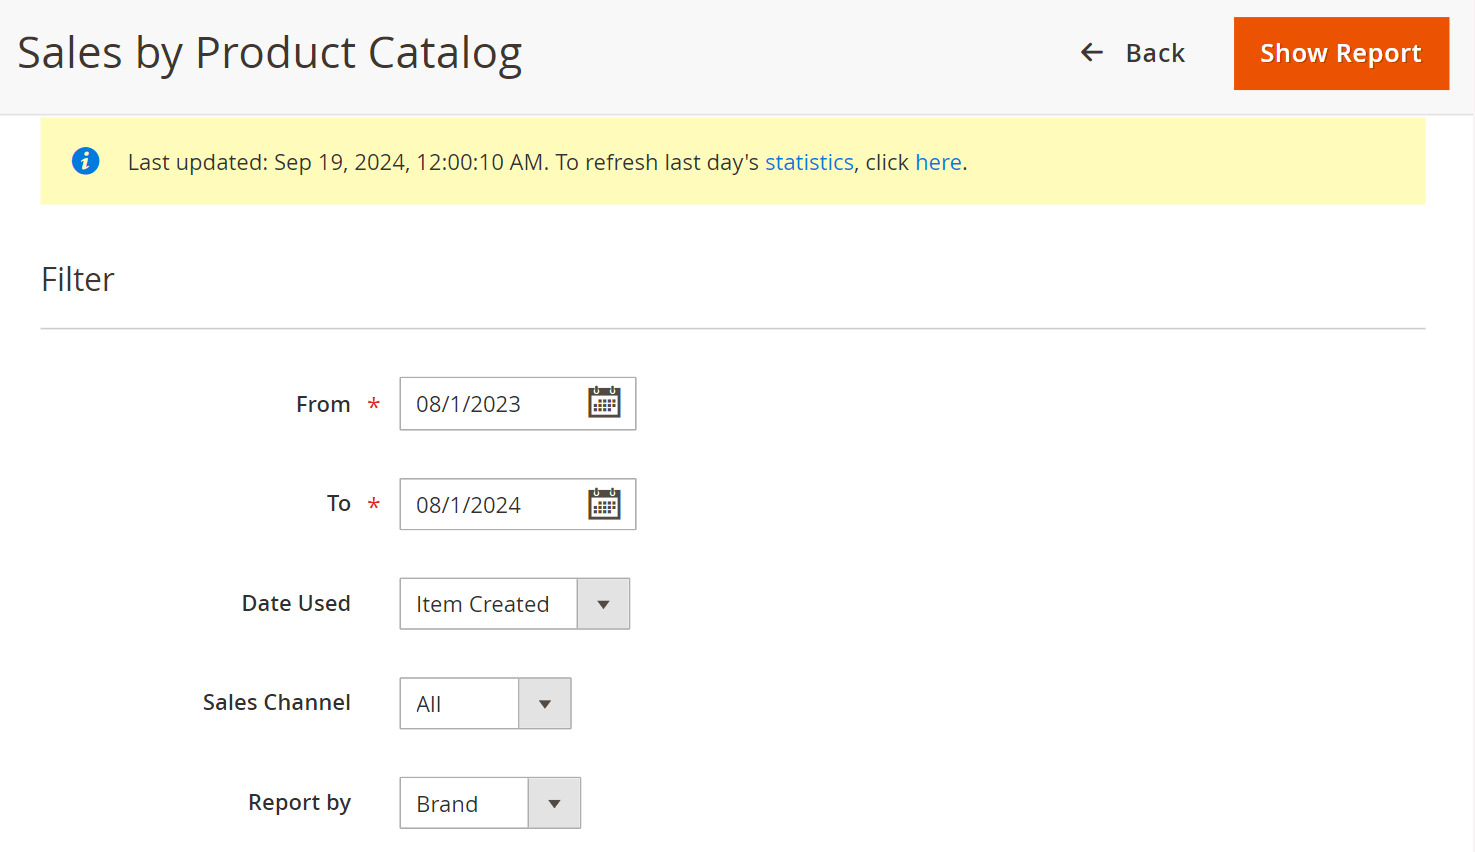
You can filter the report by Product Name, Revenue (excl. Tax) (From-To), Refunded (From-To), and Average Selling Price (From-To).
Sales by Product Performance
The Sales by Product Performance report offers crucial information for store managers looking to optimize their business decisions. With this report, you’ll:
- Get a clear view of what your customers are buying most often, helping you understand their purchasing habits
- Stay on top of current sales trends so you can adapt to changing market conditions and predict which products will have high demand at different times of the year
- Keep track of your products to see which ones are flying off the shelves and which ones are sitting stagnant, giving you a better idea of what to focus on
After selecting the order metrics at the top of the page, you can view the default columns or add additional columns from the options section.
Default filters | Advanced filters |
|
|
To view which product contributes the most profit, follow these steps: Click on the Columns option in the top-right corner of the report > from the dropdown menu, select Profit.
Now you can see that the product Chaz Kangaroo Hoodie-XS-Black (SKU: MH01-XS-Black) stands out as the top profit generator, bringing in $116.00 in profit. Meanwhile, the Strive Shoulder Pack (SKU: 24-MB04) is struggling, showing a loss of -$28.00. This tells us:
- The hoodie is a popular item, likely because of strong demand, while the shoulder pack may be seeing high refund costs
- To maximize profits, businesses should focus on marketing and managing inventory for the hoodie, while rethinking the production or pricing of the shoulder pack to minimize losses
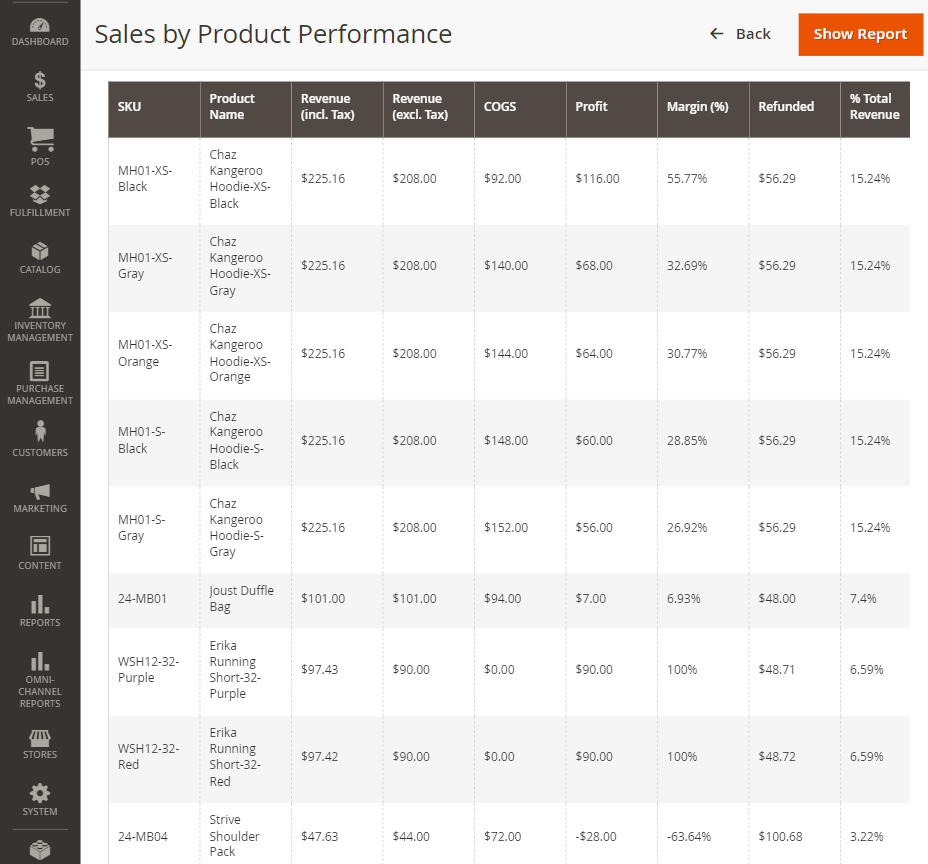
You can filter the report by Product Name, Revenue (excl. Tax) (From-To), Refunded (From-To), and Average Selling Price (From-To).
To highlight the geographical areas where products perform well, let’s take a look at the Sales by Country report.
Sales by Country
Merchants can use the Sales by Country report to identify high-performing regions and map out strategies accordingly. This valuable information enables you to:
- Single out which markets are thriving and which may need more attention
- Monitor regional trends: The data reveals how sales shift during cultural events and local holidays.
- Tailor products to local markets: Understanding regional preferences allows businesses to adjust their offerings to better suit what customers in different areas want.
- Strengthen global expansion: Knowing how your products perform in different countries helps shape your expansion plans to better align with local market conditions.
Upon selecting the order metrics at the top of the page, you can see the default columns or add any other advanced columns from the options section.
Default filters | Advanced filters |
|
|
For example, to view the Tax data, click on the Columns option in the top-right corner of the report, and from the dropdown menu, select Tax.
By analyzing the data in the column and chart reports, you can:
- Keep track of your tax liabilities in different countries
- Consider shifting resources to focus on regions with more favorable tax conditions
- Use this alongside the Sales by Product Feature report to spot regional preferences for certain types of products
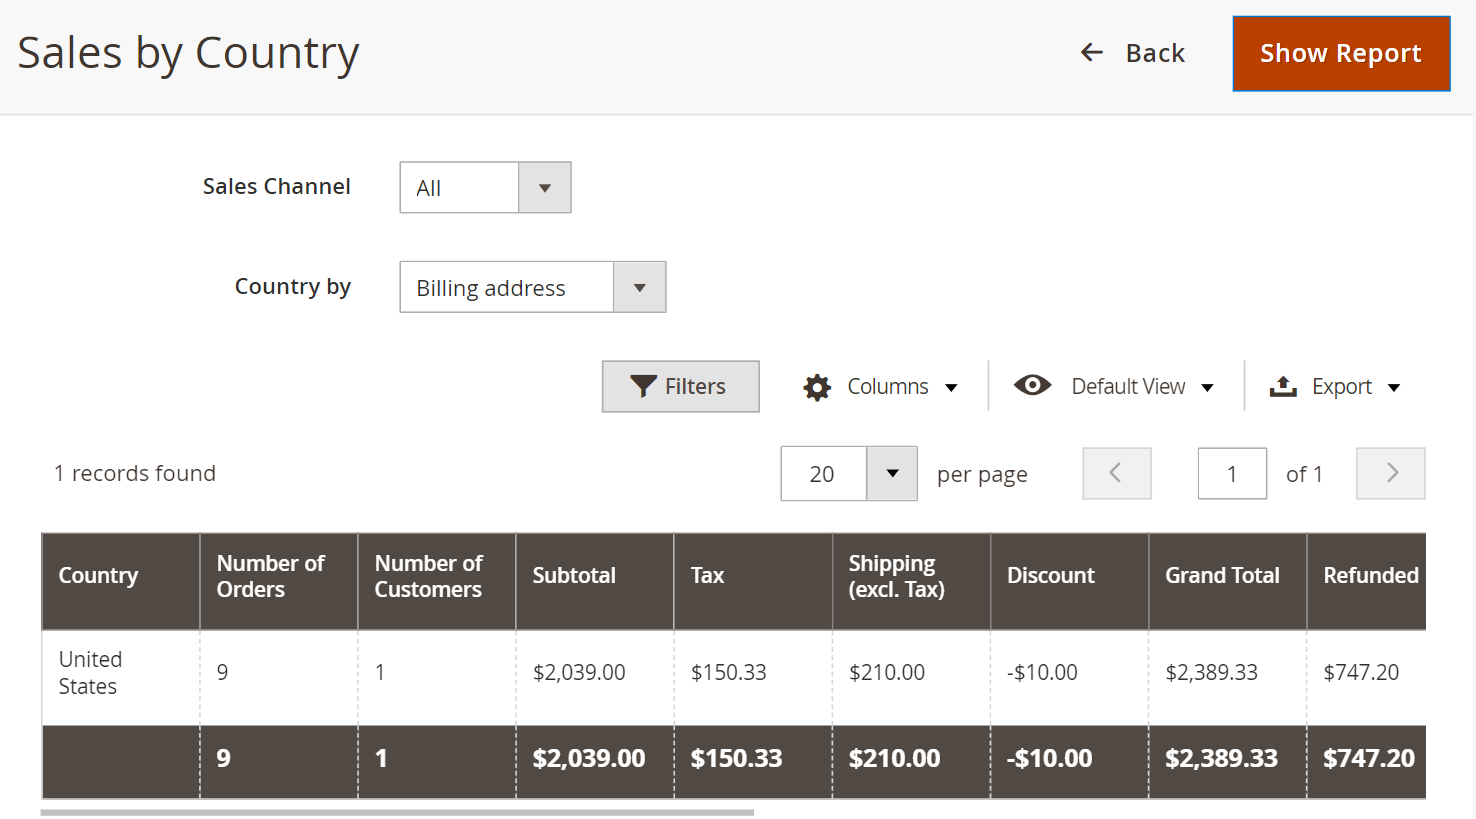
You can filter the report by Country, Subtotal, Tax, Shipping, Grand Total, and Refunded.
Sales by Payment Type
The Sales by Payment Method report discloses which payment methods customers prefer most during checkout or refunds.
After selecting the order metrics at the top of the page, you can view the default columns or customize the report by adding additional columns from the options section.
Default filters | Advanced filters |
|
|
To check how many successful transactions and refunds the most popular payment method Check/Money Order involves, click on the Columns option in the top-right corner of the report, from the dropdown menu, and select Number of Selling Transactions and Number of Refunding Transactions.
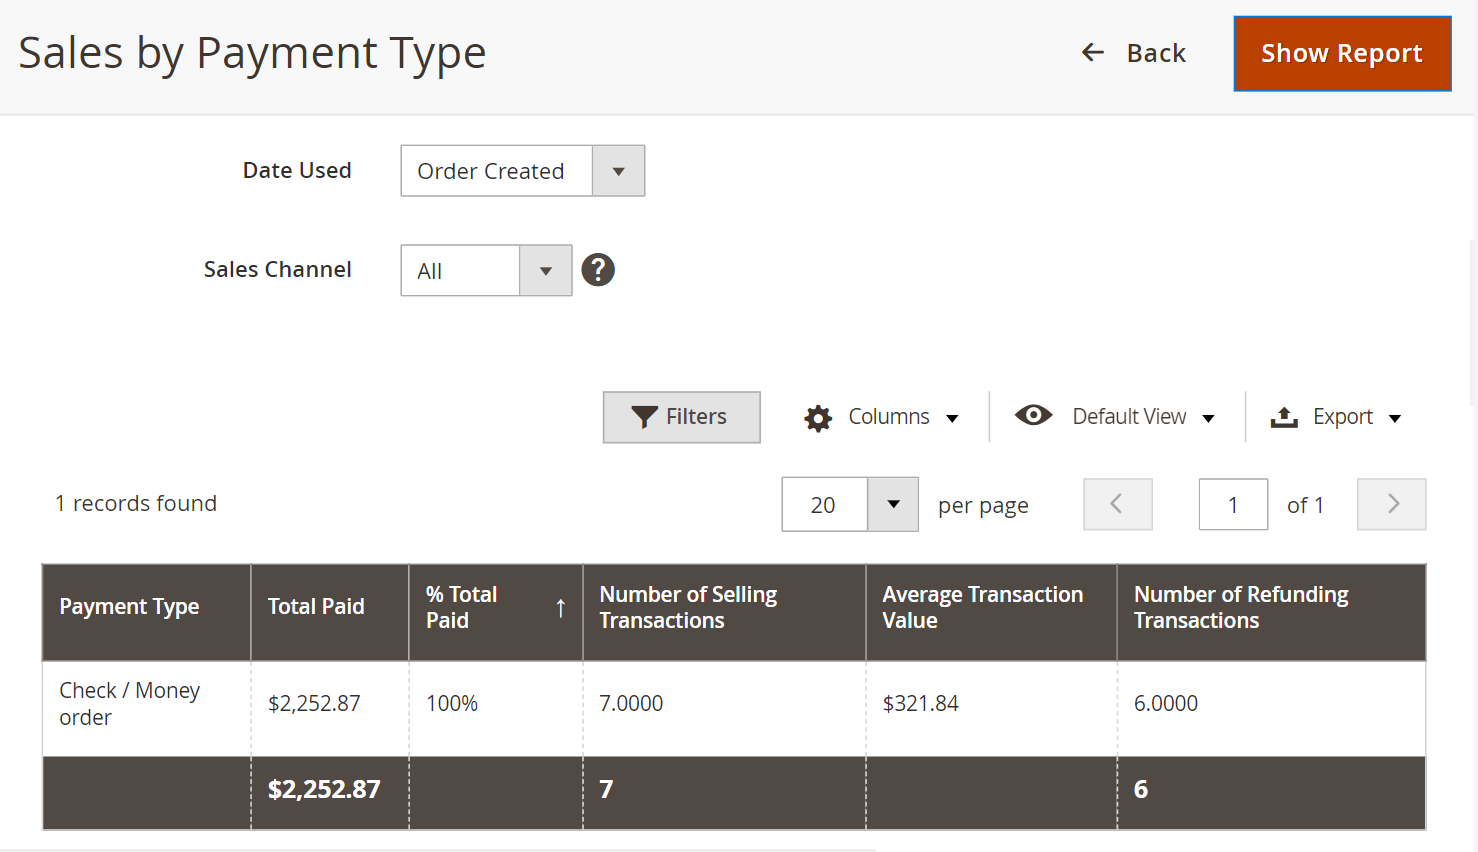
You can filter the report by the Payment Type (dropdown), Total Paid (from-to), Number of Selling Transactions (from-to), and Average Transaction Value (from-to).
You might like: How to accept multiple payment methods (Guides to each type).
In conclusion
Hopefully, this article can help you gain a better understanding of sales reports and all their advantages. If you want to experience these 9 reports, book a free demo with us to see how it works. In case you want to customize any report to your needs, we’re more than happy to assist your business.