Website benchmarking tells you the position of your website against your competitors in the same eCommerce industry. It helps business owners assess your ranking in the marketplace, providing invaluable information on why and how you’re standing at the current place.
Benchmarking is fundamental to create your business strategy. Understanding its importance, this article introduces 6 key eCommerce website benchmarks and how to measure them. Retailers can compare your metrics to see if they need improvement.
What are the types of benchmarking?
Basically, benchmarking is the use of a structured framework to learn from others’ experiences. To do that, it involves 3 basic characteristics:
- Measure through comparison
- Lead to continuous improvement
- Implement systematically
There is no universal procedure for benchmarking yet, but rather a collection of different types of benchmarking efforts.
Depending on specific goals, you can choose the benchmark that is right for you. In the broadest category, you can categorize benchmarking processes by the objective of the comparison: Who do you compare yourself to?
Here arise 2 types of benchmarks: internal and external.
- Internal benchmarking: measure and compare different components of the same scope within your business. For example, the HR managers in your company may like to assess the employee retention rate of each department.
- External benchmarking: expose you to standards outside of your business. From different external comparison angles, we can break the benchmarking process into further sub-categories:
- General benchmarks: general comparisons with a variety of unrelated industries, seeking excellence beyond specific products and services
- Industry benchmarks: include other factors like suppliers and distributors
- Competitive benchmarks: compare directly with your competitors

The other way to classify benchmarking processes is by the content of the comparison. This answers the question: What do you want to compare? From there, you have 3 types of benchmarking:
- Performance benchmarks: use KPIs as the basis of comparison
- Process benchmarks: compare the steps in your activity to those outlined by others
- Strategy benchmarks: involve the best practices and core competencies to achieve organizational goals
How to set benchmarks and track your website performance
Create measurable benchmarks for your website
How many benchmarks you set for your website will depend on your particular needs and business. You can benchmark any measurable segment of your lead generation and related eCommerce processes, such as:
- Site performance benchmarking
- Marketing performance benchmarking
- Financial performance benchmarking
- Search performance benchmarking
- Usability benchmarking
Track website performance
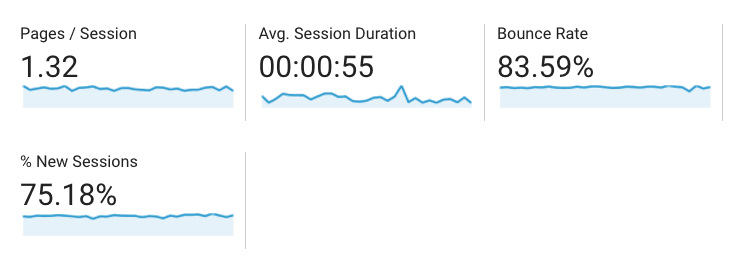
For most websites, we recommend using Google Analytics to have a big picture of your visitors and website, including:
- Where customers come from
- How customers find your website
- How long customers stay on your website
- Whether your customers are returning or new ones
- The operating system, browser, and type of device (desktop, laptop, or mobile) customers use
- How many customers converted following the built campaign
- What interaction leads to the purchase and conversion rate
You can connect to Google AdWords campaign to measure the efficiency of paid traffic.
Website benchmarking for eCommerce
1. Traffic source — Wolfgang KPI Report (2020)
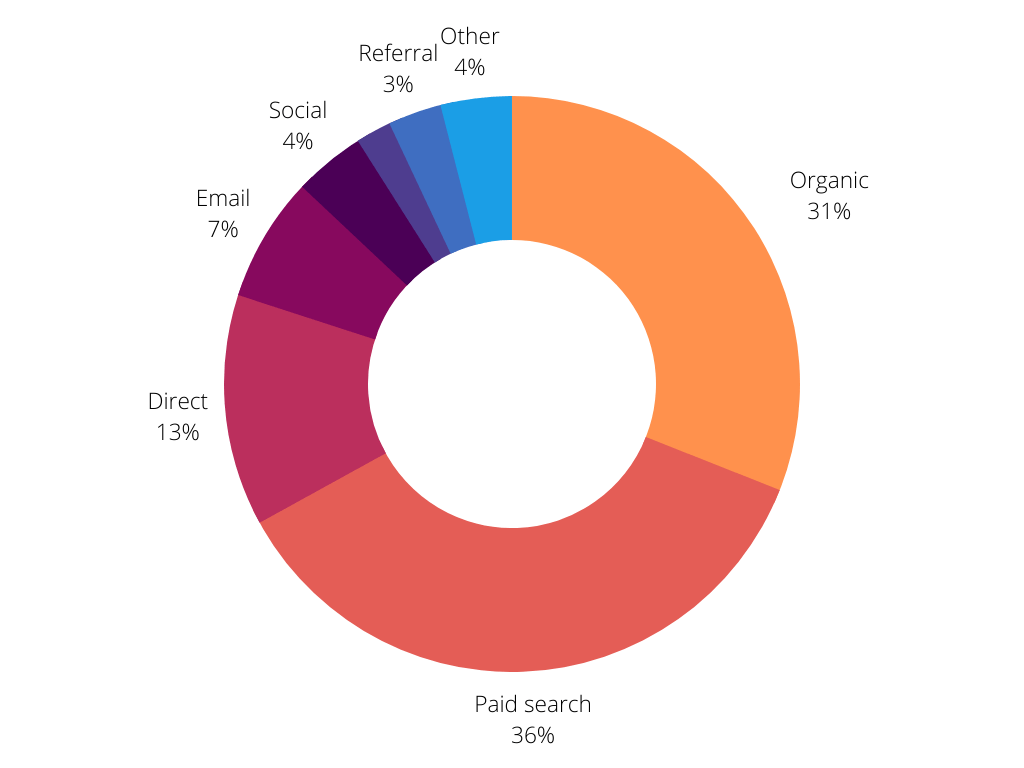
#1.1. eCommerce website benchmarks — Traffic sources by visitors
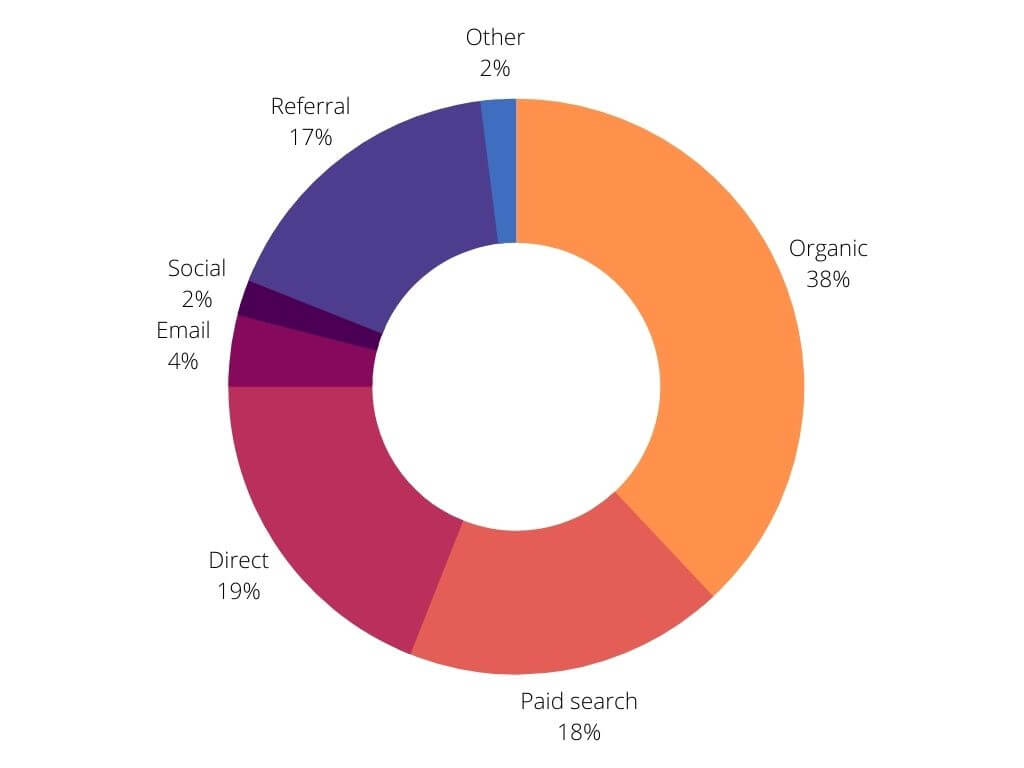
#1.2. eCommerce website benchmarks — Traffic sources by revenue
Metric highlights
Traffic sources show you how your website is attracting traffic. This is an important factor for calculating bounce rate and conversion rate. You can compare your traffic with your competitors to get a measure of the effectiveness of your advertising, inbound marketing, and branding efforts. They indicate the effectiveness of your investments.
Our recommendation
You can compare those 2 benchmarks with your eCommerce site’s traffic sources to spot which sources are doing well or underperforming.
In case you attract major organic traffic but don’t generate any sales from them, you’re probably missing some important links in dealing with the customer customer journey. You can distribute your budget and time accordingly if you know where your leads are coming from.
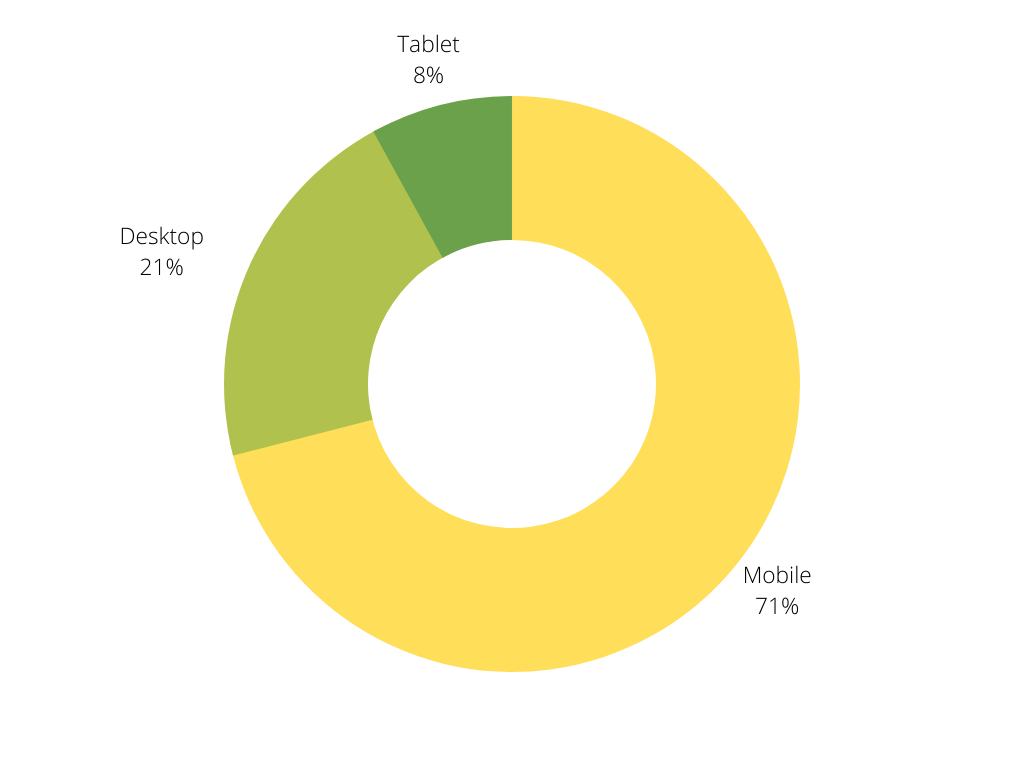
#1.3. eCommerce website benchmarks — Device type by visitors

#1.4. eCommerce website benchmarks — Device type by revenue
Metric highlights
You can easily realize from the breakdown of visitor and revenue segmentation by device type that although mobile traffic is the highest, mobile conversion rates are quite poor.
Our recommendation
You can follow our article on mobile conversion optimization best practices to improve those metrics. One of the most effective and cost-effective ways is to build a PWA storefront to optimize your mobile eCommerce, which leads to increased engagement and conversion rate in the long run.
2. On-site engagement benchmarks for eCommerce website — Wolfgang KPI Report (2020)
- Average pages per session: 5 pages
- Average session duration: 2m 57s
- Average bounce rate: 41%
- Average page load time: 5.3s
- Average server response time: 0.9s
Metric highlights
These numbers will vary widely depending on the type of website and your business industry. In general, higher engagement is better:
- More pages per session
- Higher session length
- Lower bounce rate, page load time, and server response time
Our recommendations
While some factors are quite difficult to influence, you can focus on reducing the 2 following metrics with 10 ways to speed up Magento website:
- Page loading time: A recent study reports that your customers will start to lose patience if your website doesn’t finish loading in 3 seconds. Over 3 seconds, 40% of those customers will stop and go elsewhere. That benchmark suggests a potential to improve and gain a competitive advantage.
- Bounce rate: Customers can come to your website from any landing page. If that page is compelling to lead potential customers further down the sales journey, the bounce rate will decline. Lower bounce rate means your customers are spending more time on your website and improves conversion rate, which makes this metric a great eCommerce benchmark.
3. Transaction path length — Wolfgang KPI Report (2017)
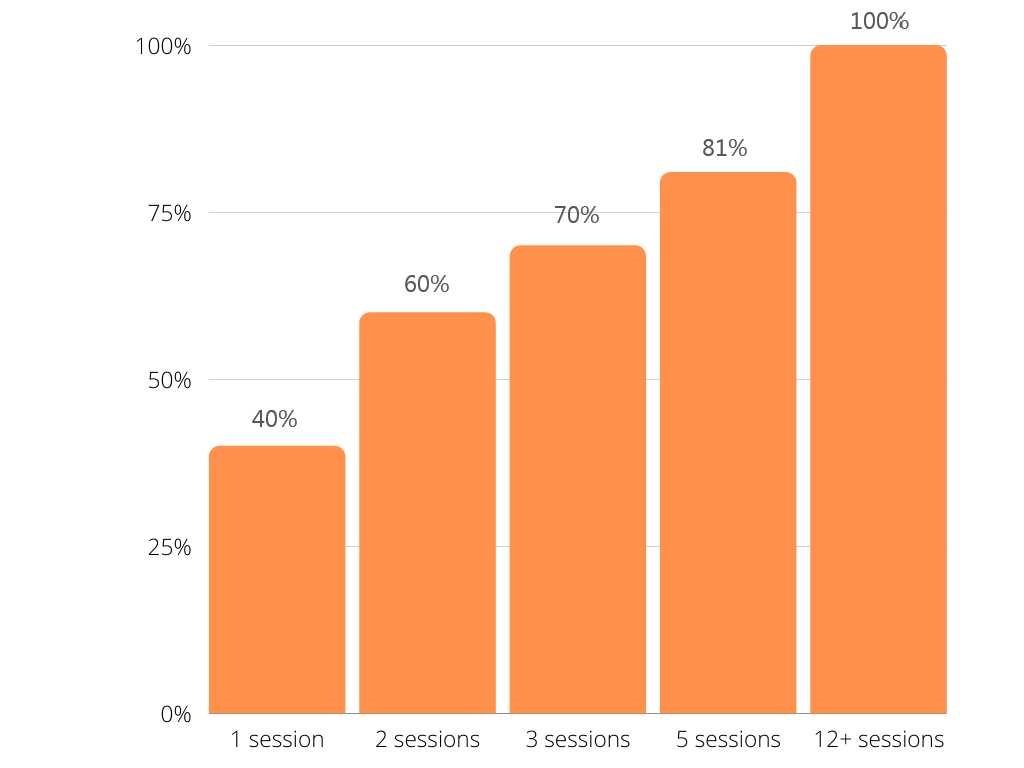
#3. eCommerce website benchmarks — Transaction path length
Metric highlights
Most businesses expect that the first time a visitor lands on their website can turn into a sale. However, this benchmark indicates that most of your sales actually come from returning visitors and customers.
Our recommendation
It’s important to define a clear remarketing strategy to drive customers back to your eCommerce site.
4. Average order value — Kibo eCommerce Quarterly (2020)
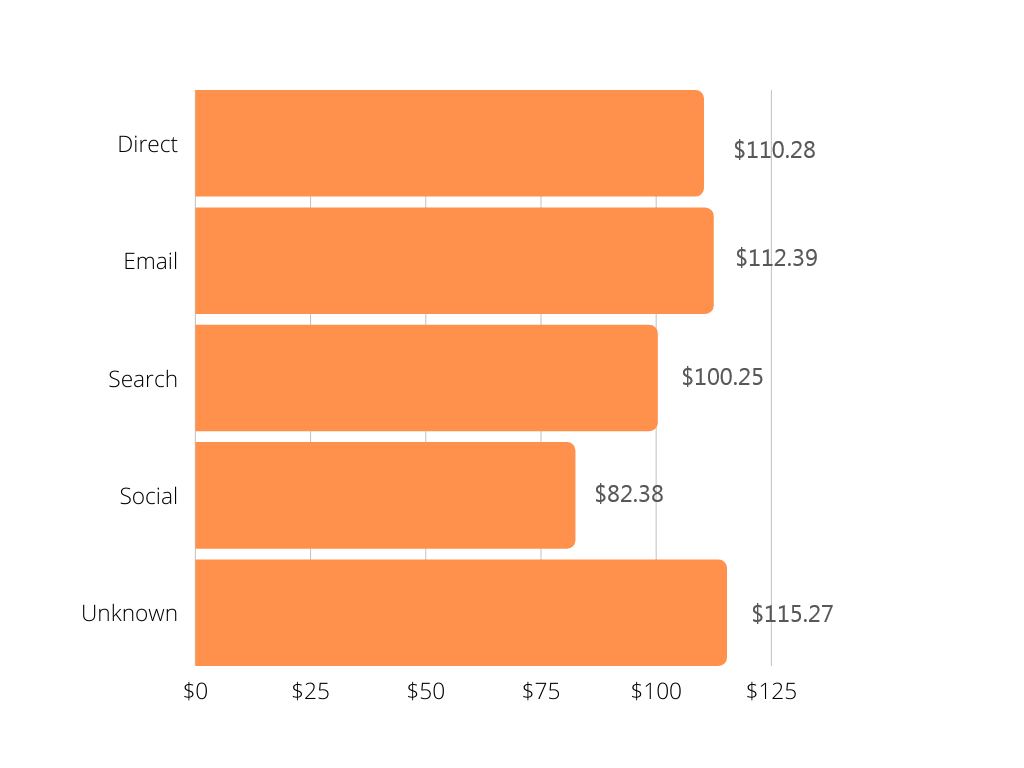
#4. eCommerce website benchmarks — Average order value by traffic source
Metric highlights
Depending on the type of product you sell, your average order value (AOV) will vary a bit compared to this general eCommerce benchmarking.
Our recommendation
If your AOV is too low, you may need new products or upsells and cross-sells to increase efficiency. By increasing the number of products per order or the value of each product, you can boost average order value and skyrocket your bottom line margins.
5. Conversion rate — iRP Commerce (2021)
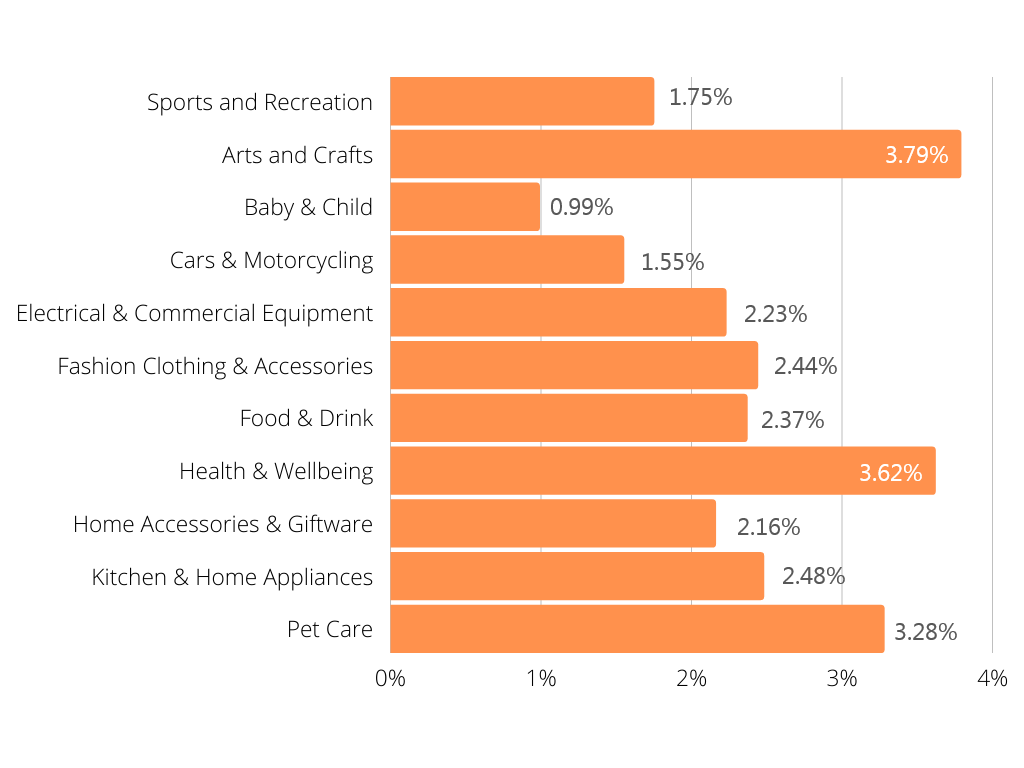
#5. eCommerce website benchmarks by industry – Conversion rates
Metric highlights
Many argue that conversion rate should not be the main metric for the success of an eCommerce website.
Conversion rates (CR) vary greatly across industry verticals, so comparing one market or store with another won’t typically produce any meaningful insights. For example, an apparel eCommerce site that sells to B2C customers will have vastly different results than a business that supplies industrial materials to B2B customers.
But that doesn’t mean conversion rates aren’t important. They make sense when used in conjunction with other important metrics in this list. It’s a great measure of the competitiveness and health of your eCommerce store.
Our recommendations
CR shows how many people who visit the website leave as a customer. It’s the direct metric that shows the quality of the traffic and proves effectiveness of your strategy and tactics. If the traffic is high but the CR is low, you may need to review the traffic sources, or take actions to nurture your visitors.
You should build your KPIs based on your specific market, data from your competitors, and internal analysis.
6. Customer retention — Metrilo Customer Retention Report (2019)
Vertical | Repeat purchase rate | Repeat customer revenue | Time between orders | Orders per customer | LTV | AOV |
Apparel | 26.0% | 59.1% | 115 | 1.8 | $218 | $120 |
CBD | 36.2% | 69.5% | 48 | 1.9 | $477 | $253 |
Coffee | 29.6% | 64.1% | 148 | 2.3 | $169 | $74 |
Cosmetics | 25.9% | 63.0% | 126 | 1.7 | $190 | $111 |
Sport apparel | 33.0% | 64.0% | 71 | 2.0 | $161 | $81 |
Meal deliveries | 29.0% | 51.0% | 41 | 1.6 | $63 | $40 |
Food products | 24.5% | 47.3% | 94 | 1.6 | $118 | $72 |
Pet products | 31.5% | 67.9% | 127 | 2.1 | $107 | $51 |
Supplements | 29.1% | 58.1% | 75 | 1.7 | $94 | $56 |
Tea | 20.9% | 48.4% | 132 | 1.5 | $55 | $36 |
Average | 28.2% | 59.6% | 102 | 1.8 | $168 | $94 |
Metric highlights
Customers returning to purchase again and again is important for any eCommerce business, especially those that sell under the subscription model.
Our recommendation
It costs less to keep your existing customers than acquiring new ones. If your customer retention is on the benchmark, you have a solid revenue stream to scale. In case Magento merchants see their retention isn’t high enough, you can run more loyalty programs to promote your store.
Conclusion
Benchmarks help you track your results by shedding light on what you’re excelling at and alerting your tough spots. They’re an essential management tool.
Without combining KPI with benchmarking, it will be difficult to reach your desired destination on time when you do not know which direction you are going and at what speed.
Website benchmarks are your knowledge and power. You will certainly be rewarded for the effort and time you put in to follow and understand them. So let’s try to mine useful insights and understand your business data, which will surely push your business forward strongly.
Once you can measure a metric, you can benchmark it. You can start by sketching out key performance indicators (KPIs) of your business and evaluating them.
If you’re considering Magento as your eCommerce platform, check out our Magento development service and see how we can help you launch and run a website with minimal disruptions.
Business owners can also check out:
- POS report guide for retail managers to improve retail operations with the most important POS reports and data
- How to measure omnichannel success with 10 KPIs on operation and customer experience

